Note: This article assumes you are using version
1.0.0or higher of@yext/pages-components.
Overview
Yext Analytics helps you understand what users are doing on your site and report on critical conversion events to help with recommendations and personalization.
Pages offers several built-in components to help you easily integrate Analytics into your website. This allows you to track built-in metrics such as page views, sessions, and call to action clicks, as well as fully custom events to further segment your data.
Implementing Yext Analytics
AnalyticsProvider
To get started, Yext provides an <AnalyticsProvider> component, which sets up the proper React context and bootstraps the Analytics reporter. In order for Analytics to fire correctly, ensure that all your page components are wrapped within this provider.
import { AnalyticsProvider } from "@yext/pages-components";
import { TemplateProps } from "@yext/pages";

  <AnalyticsProvider
    apiKey="REPLACE_WITH_API_KEY"
    templateData={templateData}
    productionDomains={["locations.yext.com"]}
    currency="USD"
  >
    <div>{children}</div>
  </AnalyticsProvider>
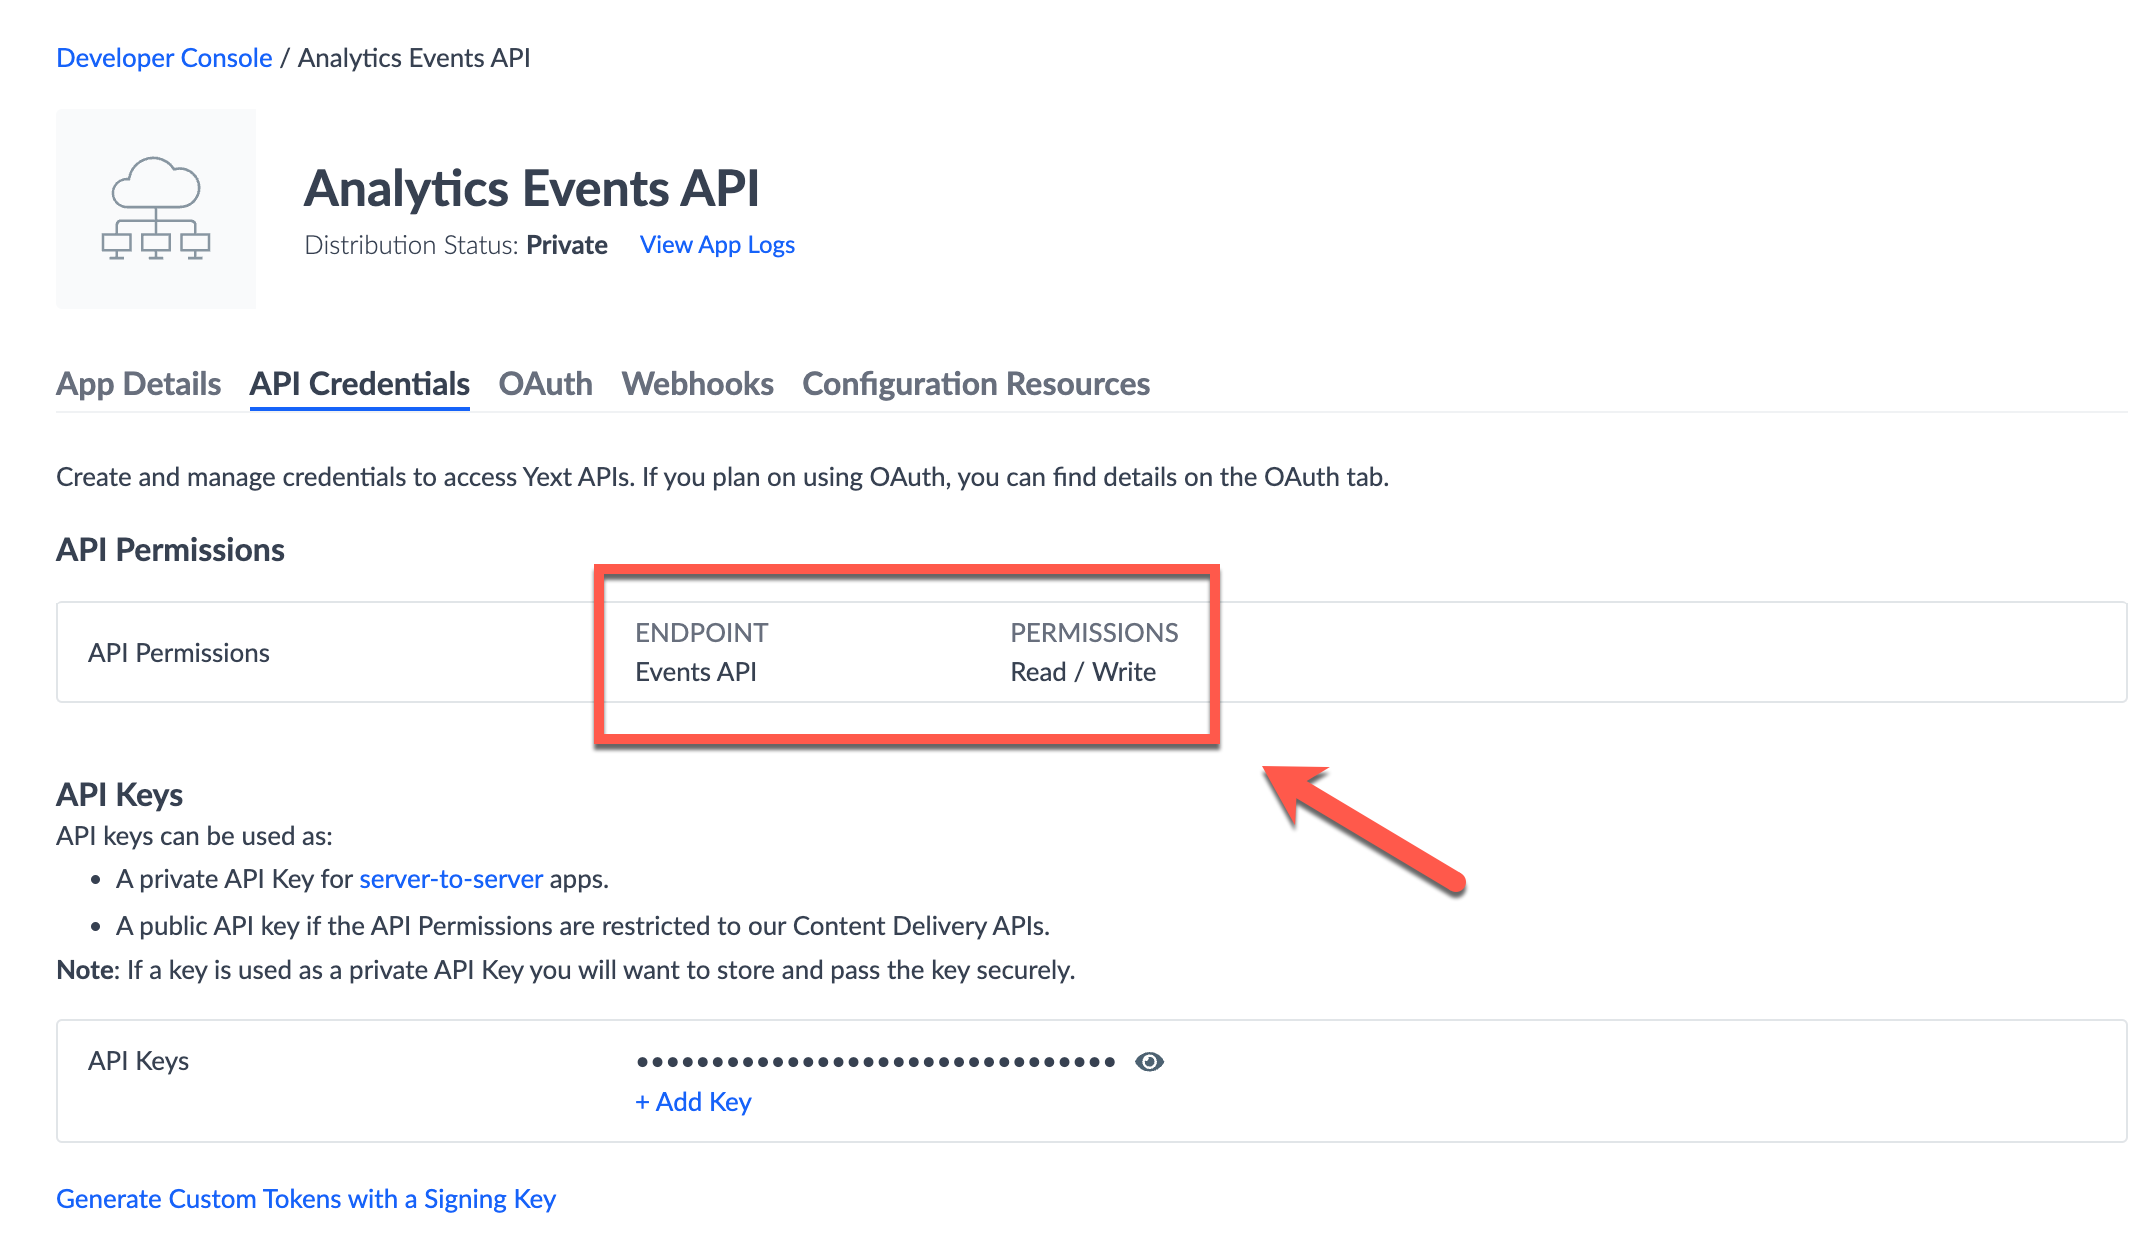
In order to use the AnalyticsProvider, you will need to create an API key with the Events API enabled in the Developer Console.
Props
Refer to the props interface below, and to our GitHub documentation for more information.
| Property | Type | Default | Description |
|---|---|---|---|
apiKey |
string | API key with the Events API enabled with read/write permission. Required in order for your application to send analytics data to your Yext account. | |
templateData |
TemplateProps (interface definition)
|
The TemplateProps that come from the rendering system. | |
currency |
string | The ISO 4217 currency code of the currency the value is expressed in. For example, "USD" for US dollars. | |
requireOptIn? |
Should be set to true if your compliance requirements require you to put all marketing analytics behind a user opt-in banner or if you use a Compliance Management tool of some kind. |
||
productionDomains? |
string[] |
isStaging() will evaluate to true if the event is fired from any of provided domains in this array. This allows you to explicitly define the domains for which analytics events should be registered. |
|
enableDebugging? |
boolean | When set to true, this exposes tracked events in the developer console for helpful debugging. |
|
enableTrackingCookie? |
boolean | When set to true, this will set a tracking cookie when a user does any trackable action on your site, such as a page view, click, etc. |
|
disableSessionTracking? |
boolean | When true, this sets sessionId to undefined in the event payload when a user does any trackable action on your site, such as a page view, click, etc. |
AnalyticsScopeProvider
The <AnalyticsScopeProvider> component allows you to group analytics events together.
For example, you may want to group all clicks within the header of your page to determine how frequently users interact with it. To do so, define a header analytics scope. For each event fired from within that scope, the event ID will be prepended with header_.
const PageLayout = ({ children, templateData }: PageLayoutProps) => {
  return (
    <AnalyticsProvider
      apiKey={YEXT_PUBLIC_EVENTS_API_KEY}
      templateData={templateData}
      productionDomains={["locations.yext.com"]}
      currency="USD"
    >
      <div className="min-h-screen">
        <AnalyticsScopeProvider name="header">
          <Header />
        </AnalyticsScopeProvider>
        {children}
        <AnalyticsScopeProvider name="footer">
          <Footer />
        </AnalyticsScopeProvider>
      </div>
    </AnalyticsProvider>
  );
};
Props
| Property | Type | Default | Description |
|---|---|---|---|
name |
string | Defines the name of an Analytics scope. All analytics event names fired from components within this scope will be prepended with name. |
Link Component
Any click on the Link component placed under an AnalyticsProvider will register a click event in the Yext analytics system. This component has an onClick handler that runs before the link redirects.
The example below shows three types of tracked links: Get Directions, Tap to Call, and Call to Action clicks.
<AnalyticsScopeProvider name="ctas">
  <Link
    href={`https://www.google.com/maps/dir/?api=1&destination=${name} ${address.line1} ${address.city} ${address.region} ${address.postalCode}`}
    eventName="getdirections"
    amount={10}
  >
    Get Directions
  </Link>
  <Link
    href={`tel:${mainPhone}`}
    eventName="call"
    amount={2}
  >
    {formatPhoneNumber(mainPhone)}
  </Link>
  <Link
    className="primary-cta"
    cta={{
      link: cta.link,
      linkType: cta.linkType,
      label: cta.label,
    }}
  >
    {cta.label}
  </Link>
</AnalyticsScopeProvider>
Props
| Property | Type | Default | Description |
|---|---|---|---|
href? |
|||
className |
string | ||
eventName? |
string | ||
cta? |
CTA (interface definition)
|
Takes in a CTA field from the Knowledge Graph. |
|
currency? |
string | The ISO 4217 currency code of the currency the value is expressed in. Overrides the defaultCurrency set on the provider. For example, "USD" for US dollars. |
|
amount? |
integer | The monetary value of the event. Used to attribute cost estimates to your analytics activity. |
Conversion Tracking
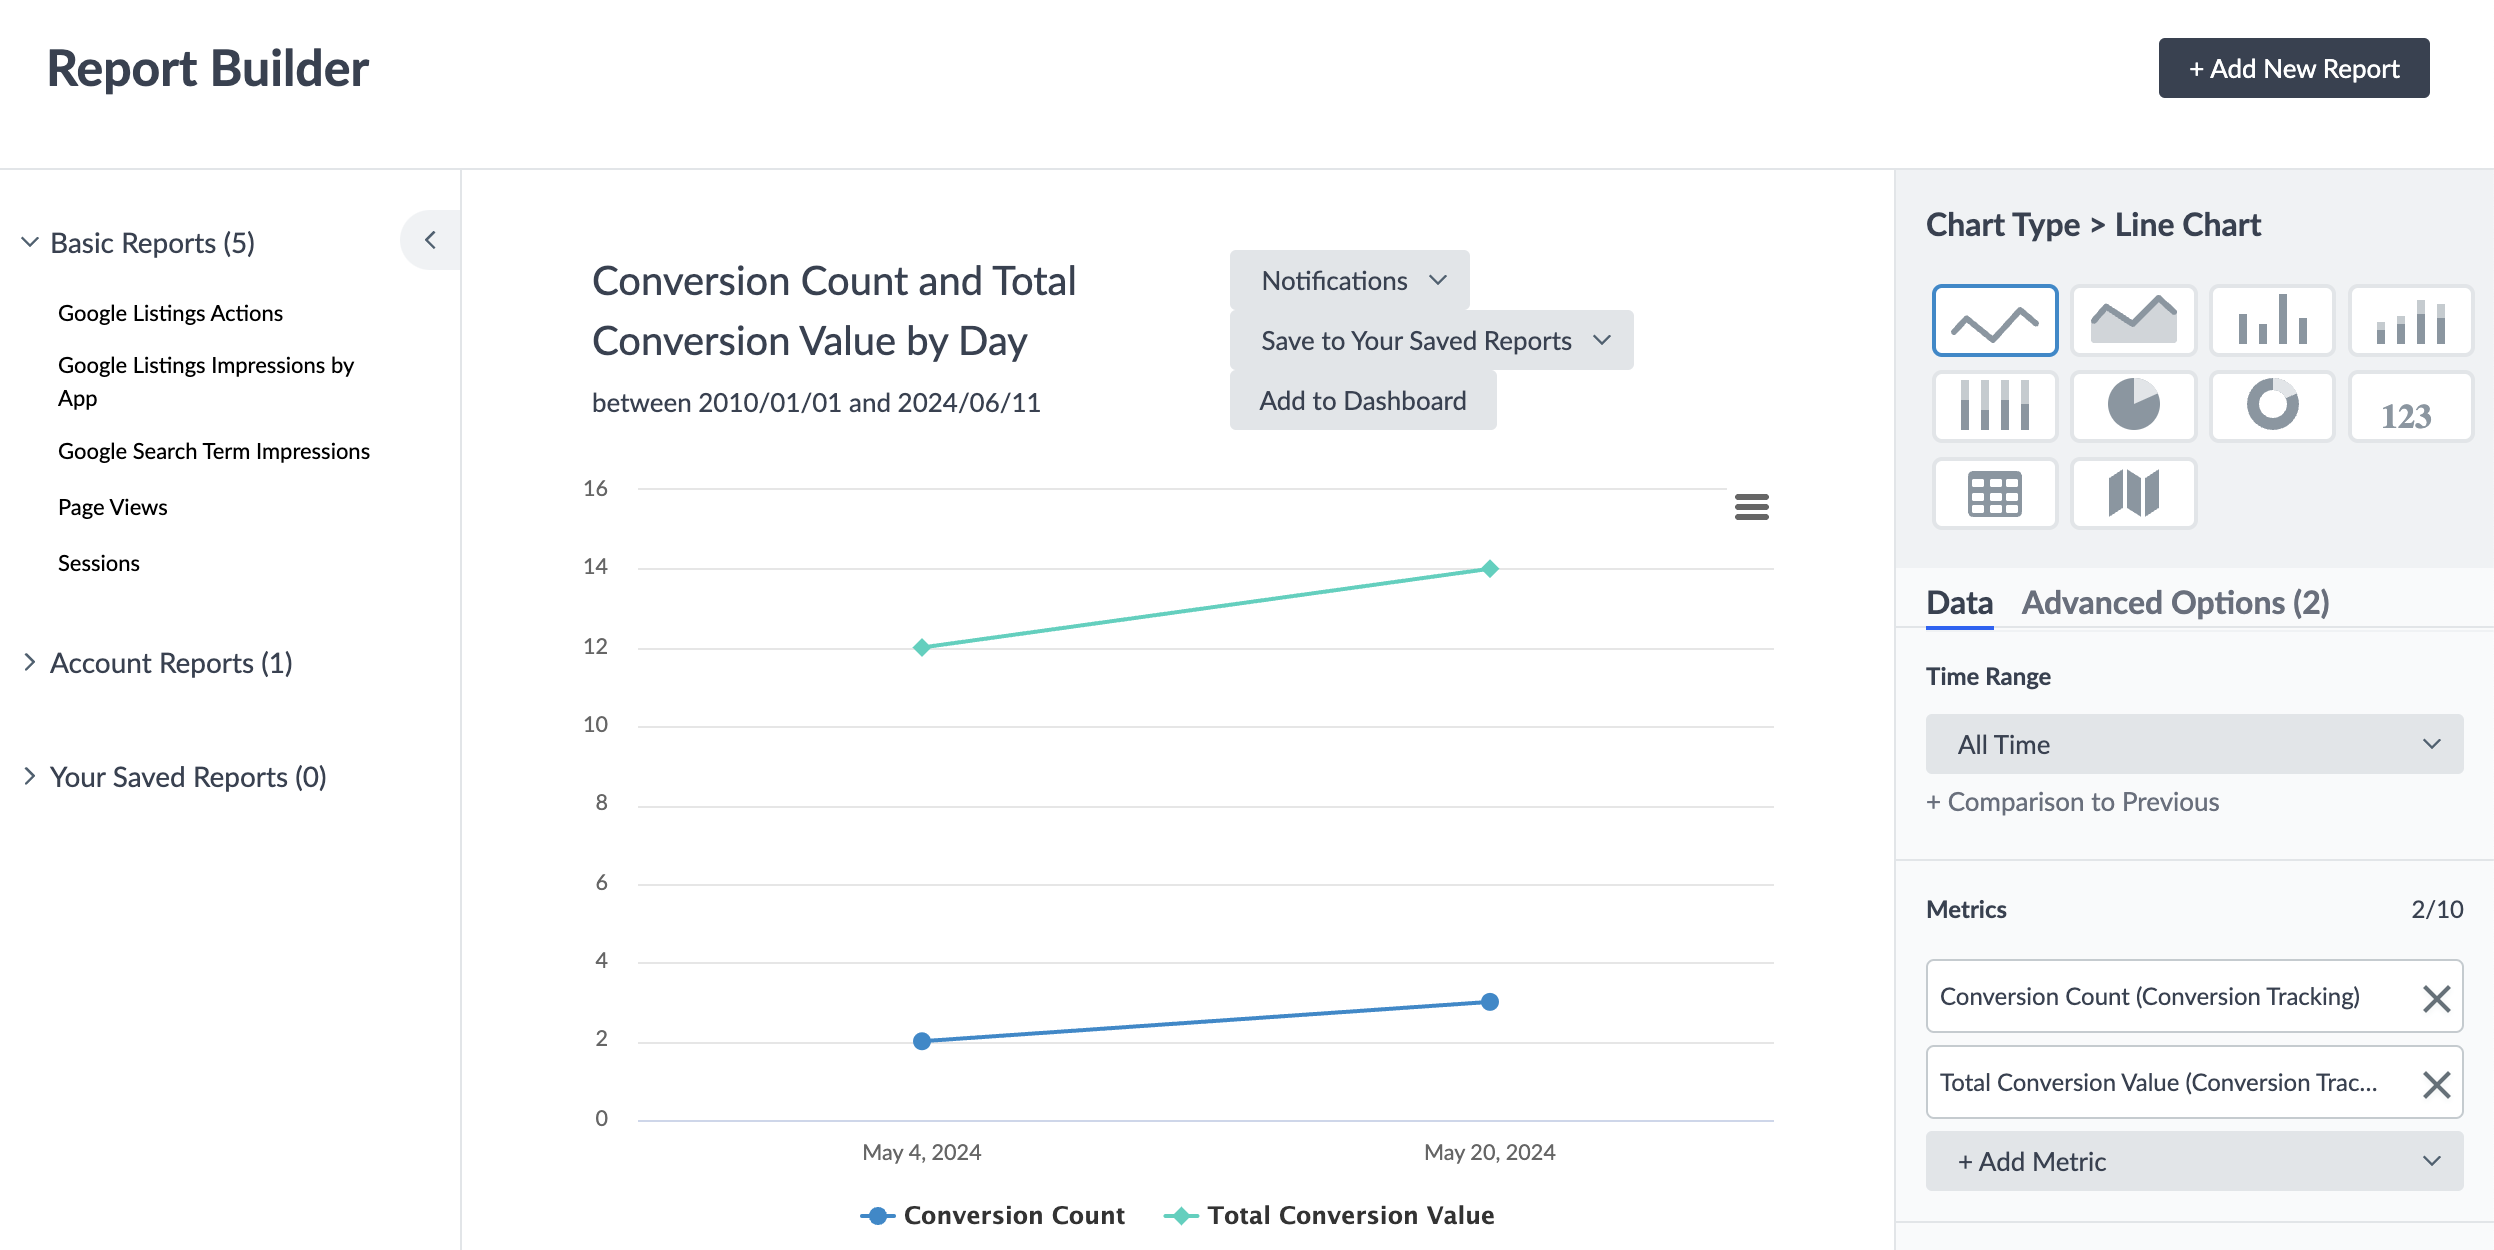
In Yext Analytics, conversion tracking is facilitated through the amount property on the Link component. By specifying a monetary value, you can attribute dollar amounts to conversions triggered by clicks.
<AnalyticsScopeProvider name="ctas">
  <Link
    href="https://www.example.com"
    eventName="purchase"
    amount={29.99}  // Indicates the conversion value of this action
  >
    Buy Now
  </Link>
</AnalyticsScopeProvider>
Once the amount is specified, these values are tracked every time the associated event occurs. You can then use Yext's Report Builder to create custom reports that include these conversion values.
Opt-In Tracking (GDPR and CCPA)
To require user consent before initiating analytics tracking, set the requireOptIn property to true on AnalyticsProvider. This ensures that analytics events are not recorded until consent is explicitly granted.
const PageLayout = ({ _site, children, templateData }: Props) => {
  return (
    <AnalyticsProvider
      apiKey={YEXT_PUBLIC_EVENTS_API_KEY}
      templateData={templateData}
      productionDomains={["locations.yext.com"]}
      currency="USD"
      requireOptIn={true}
    >
      <div className="min-h-screen">
        <Header />
        {children}
        <Footer />
      </div >
    </AnalyticsProvider>
  );
};

export default PageLayout;
With requireOptIn set to true, no analytics events will be tracked until the user has provided consent (e.g., by clicking "Accept" on a consent banner). Once consent is obtained, trigger analytics tracking by invoking the optIn method of the analytics context.
Local Development and Debugging
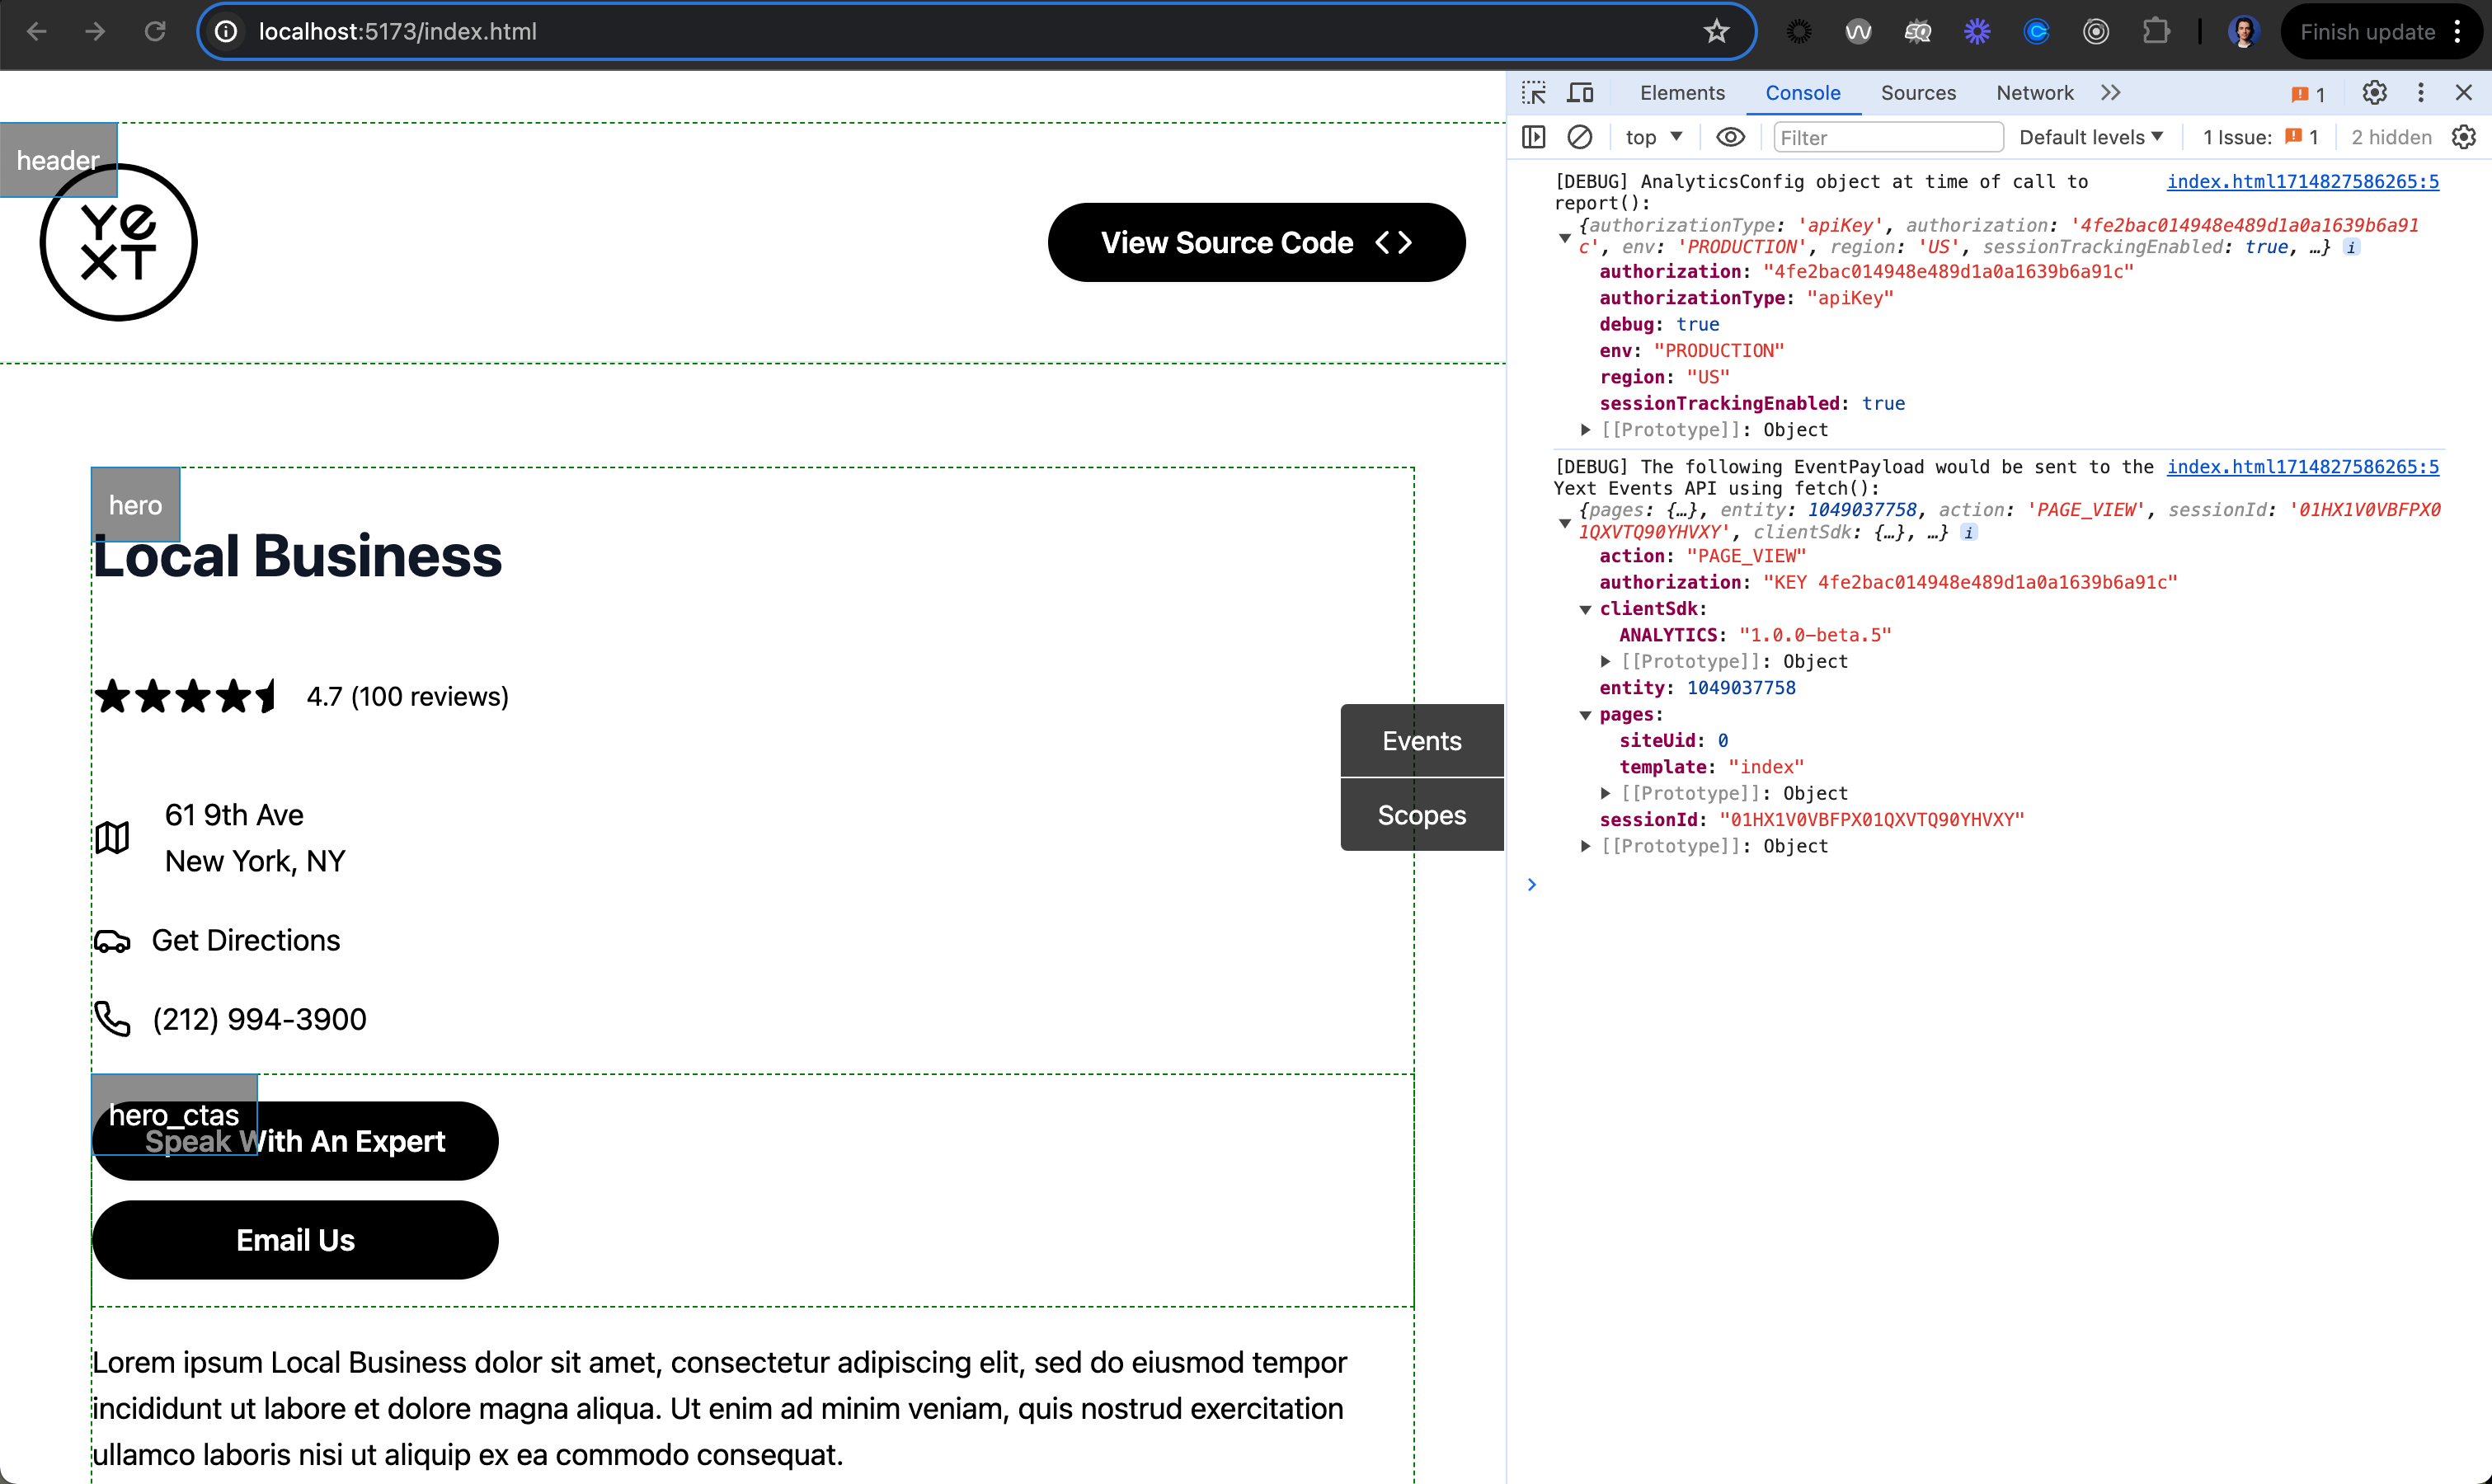
Set the enableDebugging property to true to display detailed logs in the browser console for each analytics event triggered.
import { AnalyticsProvider } from '@yext/pages-components';
import Header from './Header';
import Footer from './Footer';

const PageLayout = ({ children, templateData }) => {
  return (
    <AnalyticsProvider
      apiKey="REPLACE_WITH_API_KEY"
      templateData={templateData}
      enableDebugging={true}
      currency="USD"
    >
      <div className="min-h-screen">
        <Header />
        {children}
        <Footer />
      </div>
    </AnalyticsProvider>
  );
};

export default PageLayout;
With debugging enabled, open your browser's console to observe each analytics event: the event name, data points sent, and any errors or warnings.
Note: Ensure
enableDebuggingis turned off in production to avoid exposing sensitive information and console clutter for end users.
Analytics Debugger Tool on React Pages Sites
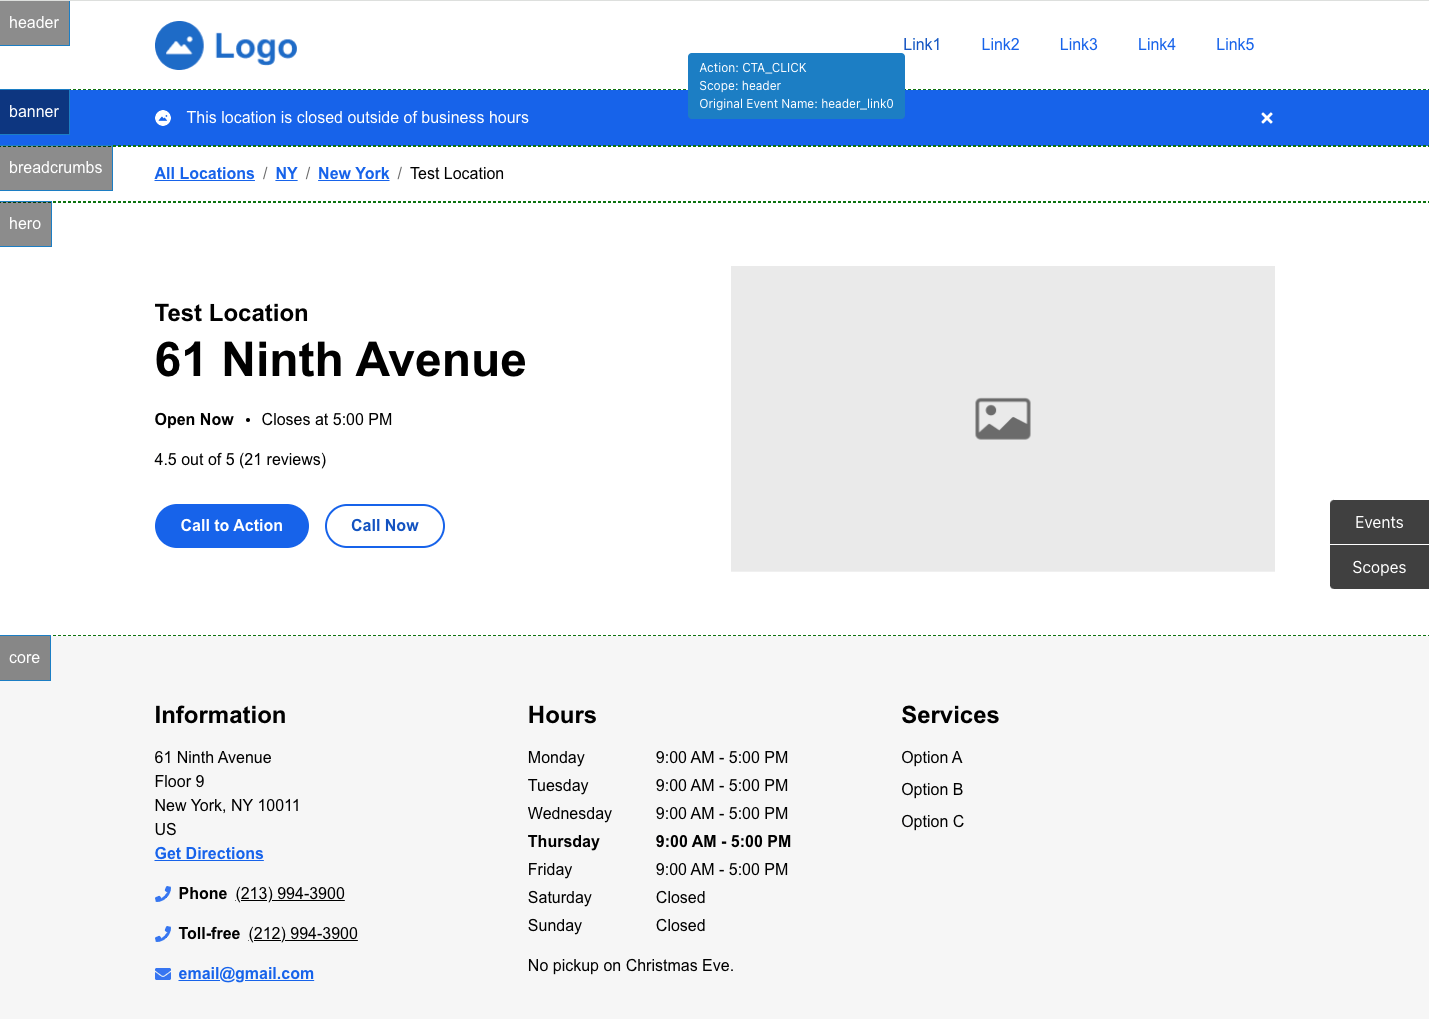
With the analytics debugger tool for React Pages sites, you can view analytics events directly from the page. Hovering over any links or CTAs will display any associated analytics events.
To use the analytics debugger tool:
- Check that the site is using
@yext/pages-componentsv1.0.1 or greater.- If the site was built and maintained by ProServe, it should be using the latest version. If not, check with the PC or lead dev.
- If the site was built by a partner, check with the partner. If they need to update and are on a version < 1.0.0, they can refer to the Upgrading to PagesJS 1.0.0 reference doc and the Consulting React starter for best practices on implementing analytics.
- Add the
xYextDebug=trueparam to the URL of the page you want to check. For example:https://site-starter.react-consulting.com.pagescdn.com/ny/new-york/61-ninth-avenue?xYextDebug=true.
Observing Analytics in the Platform
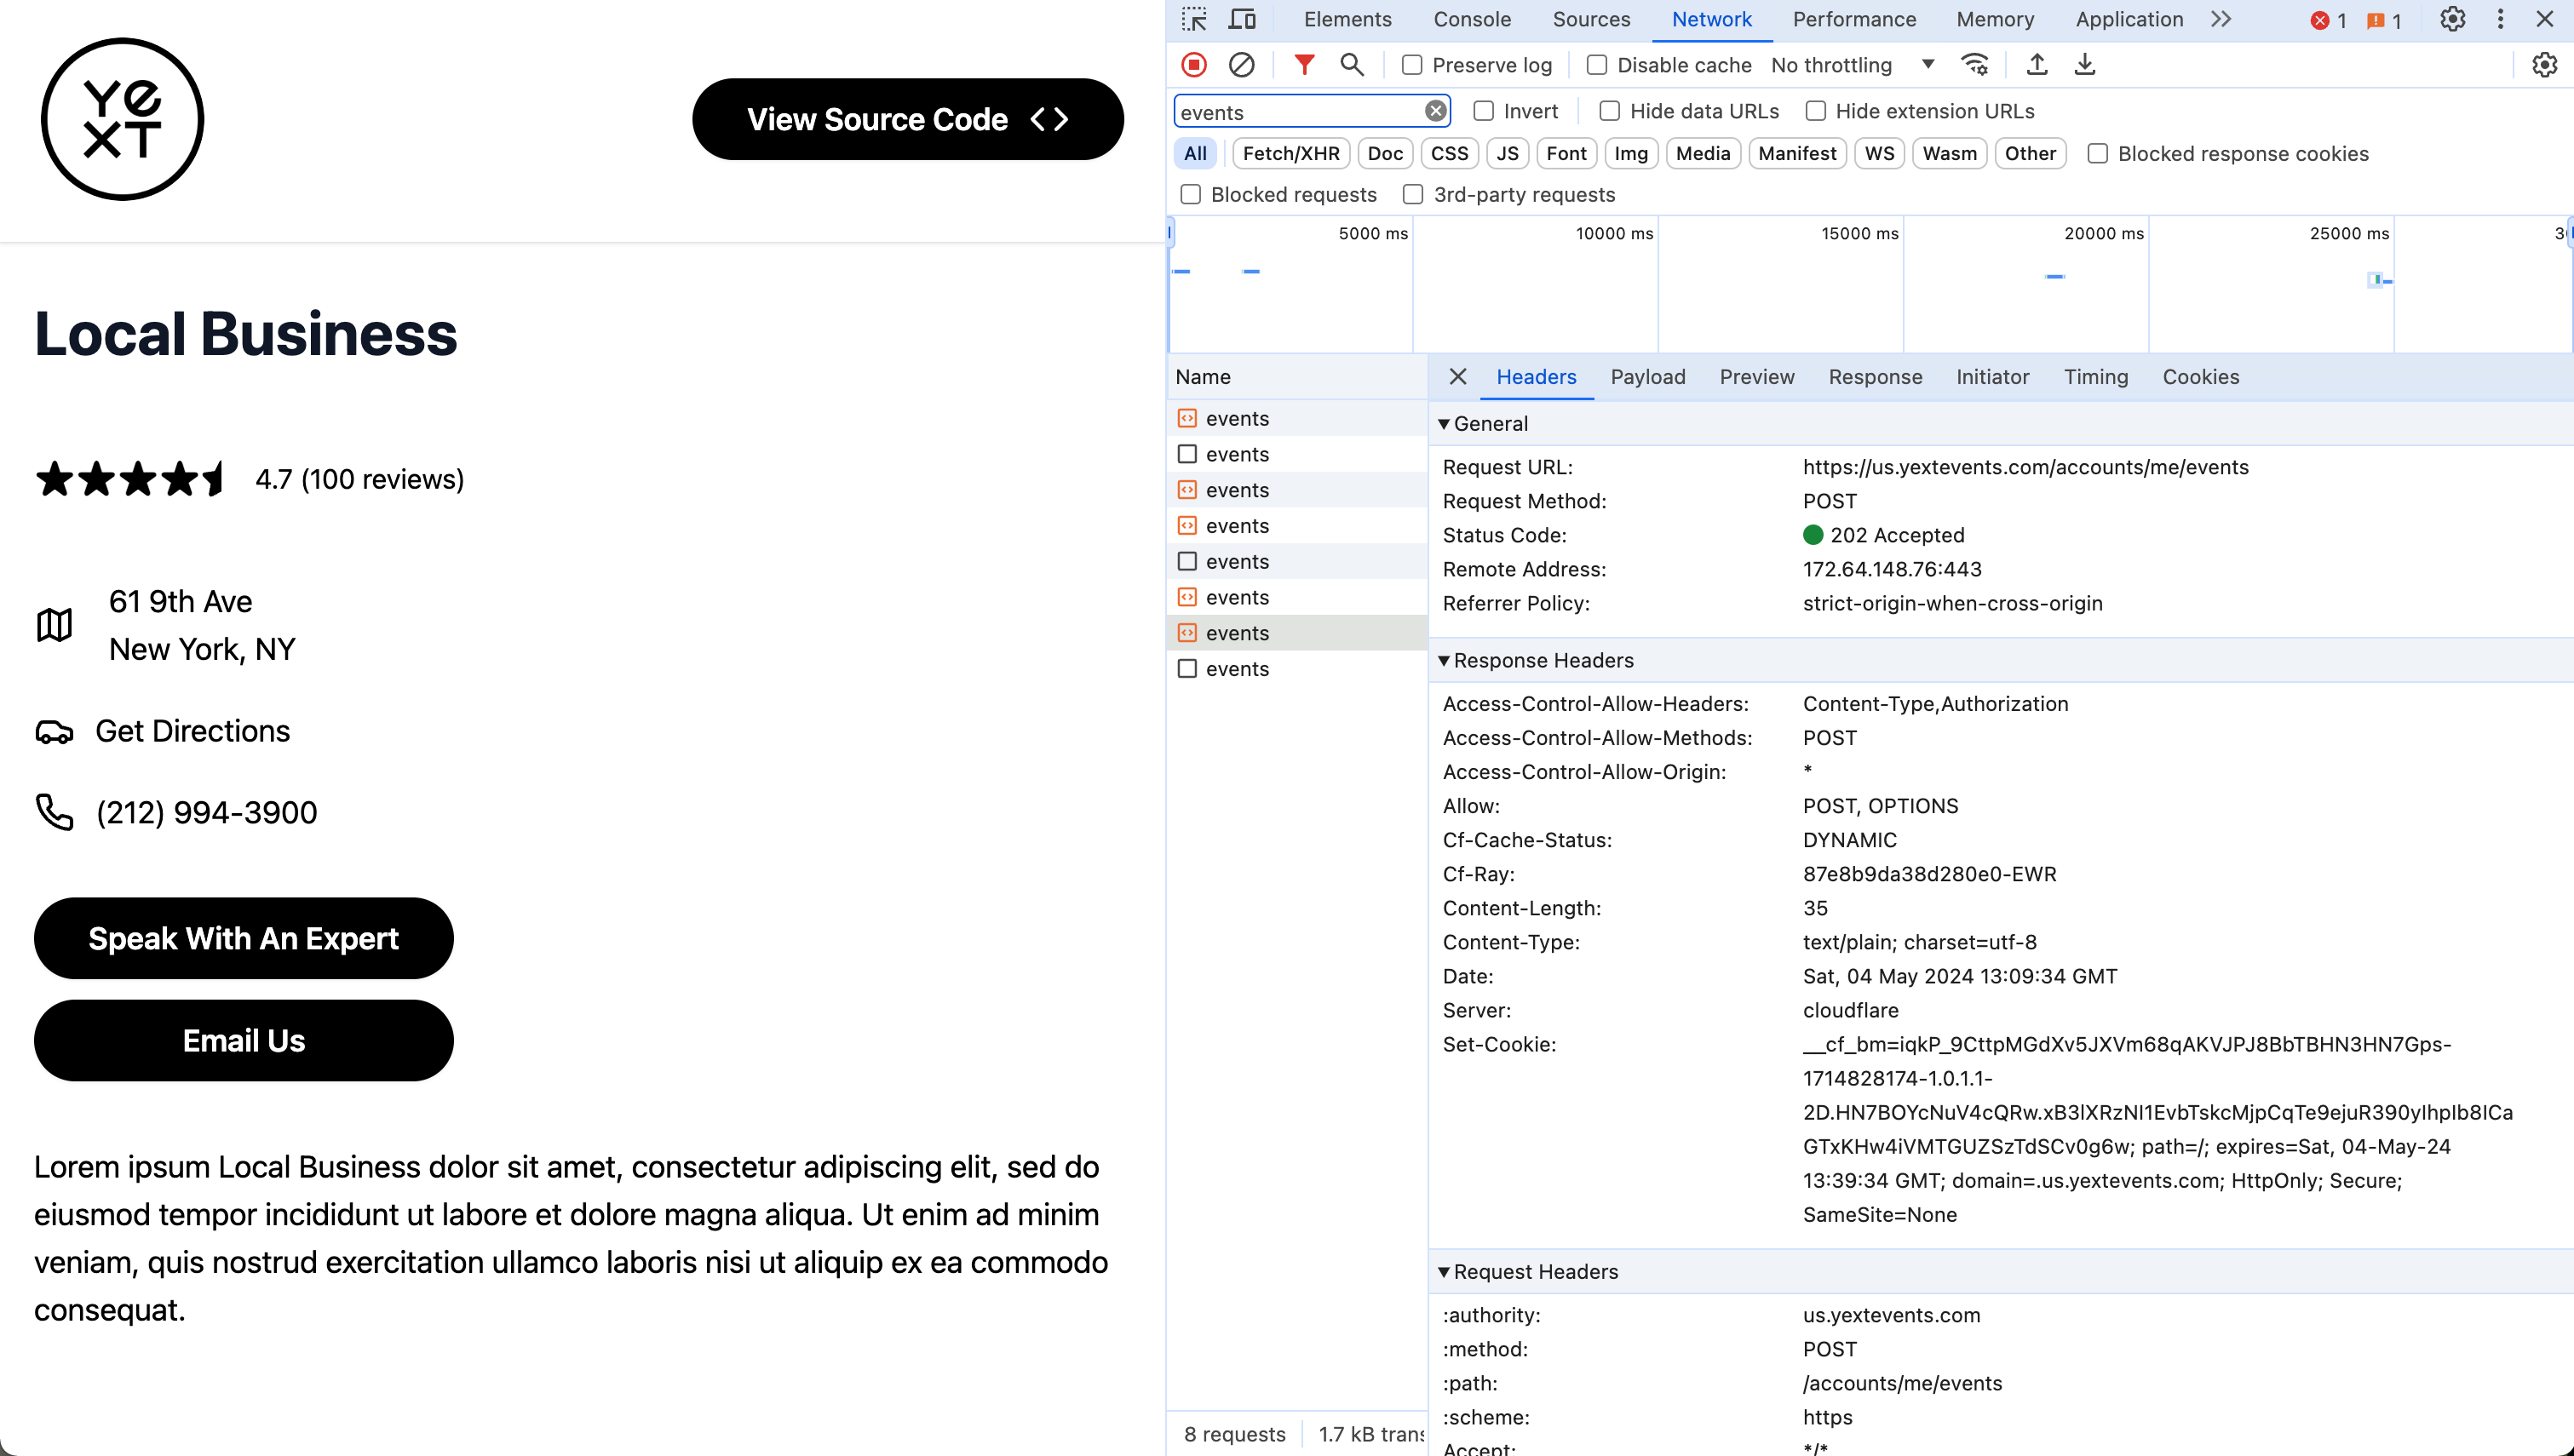
Once deployed to production, validate that analytics events are firing correctly by inspecting network requests. Confirm that POST requests are firing to https://us.yextevents.com/accounts/me/events. Your analytics events will be visible from the Yext platform within 24 hours.
Event Mapping
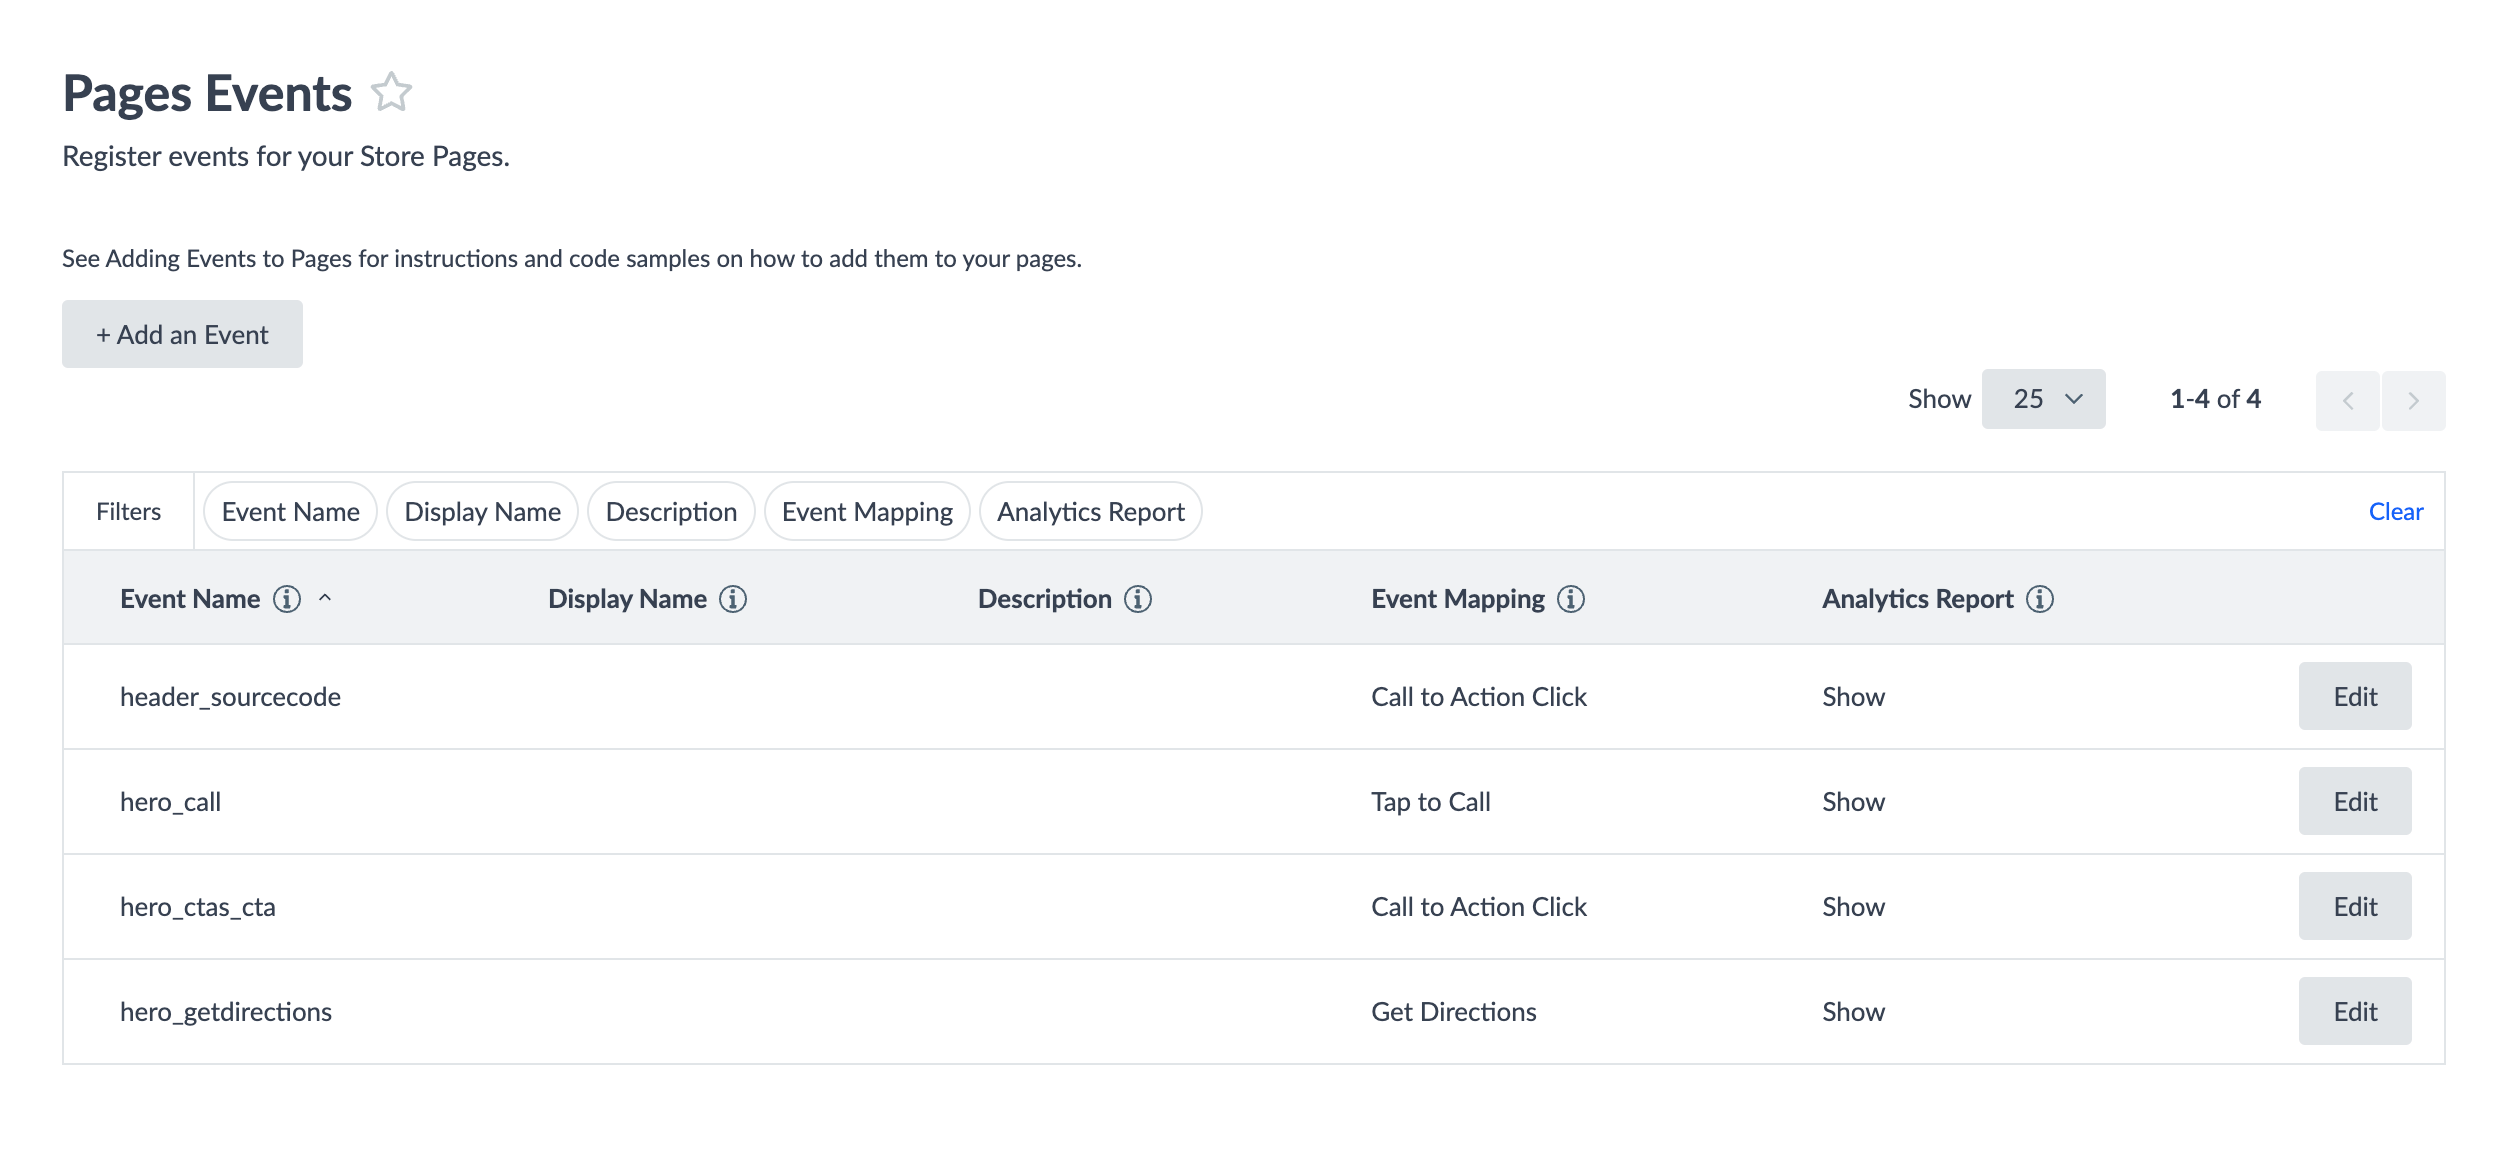
To cleanly segment your data, map your events to built-in metrics via Analytics > Pages Events in the UI.
- Edit individual events by clicking the Edit button next to the relevant event name.
- Edit events in bulk by exporting (Export Pages Events as CSV), updating the CSV, and re-importing (Import Pages Events).
How to Map Custom Events
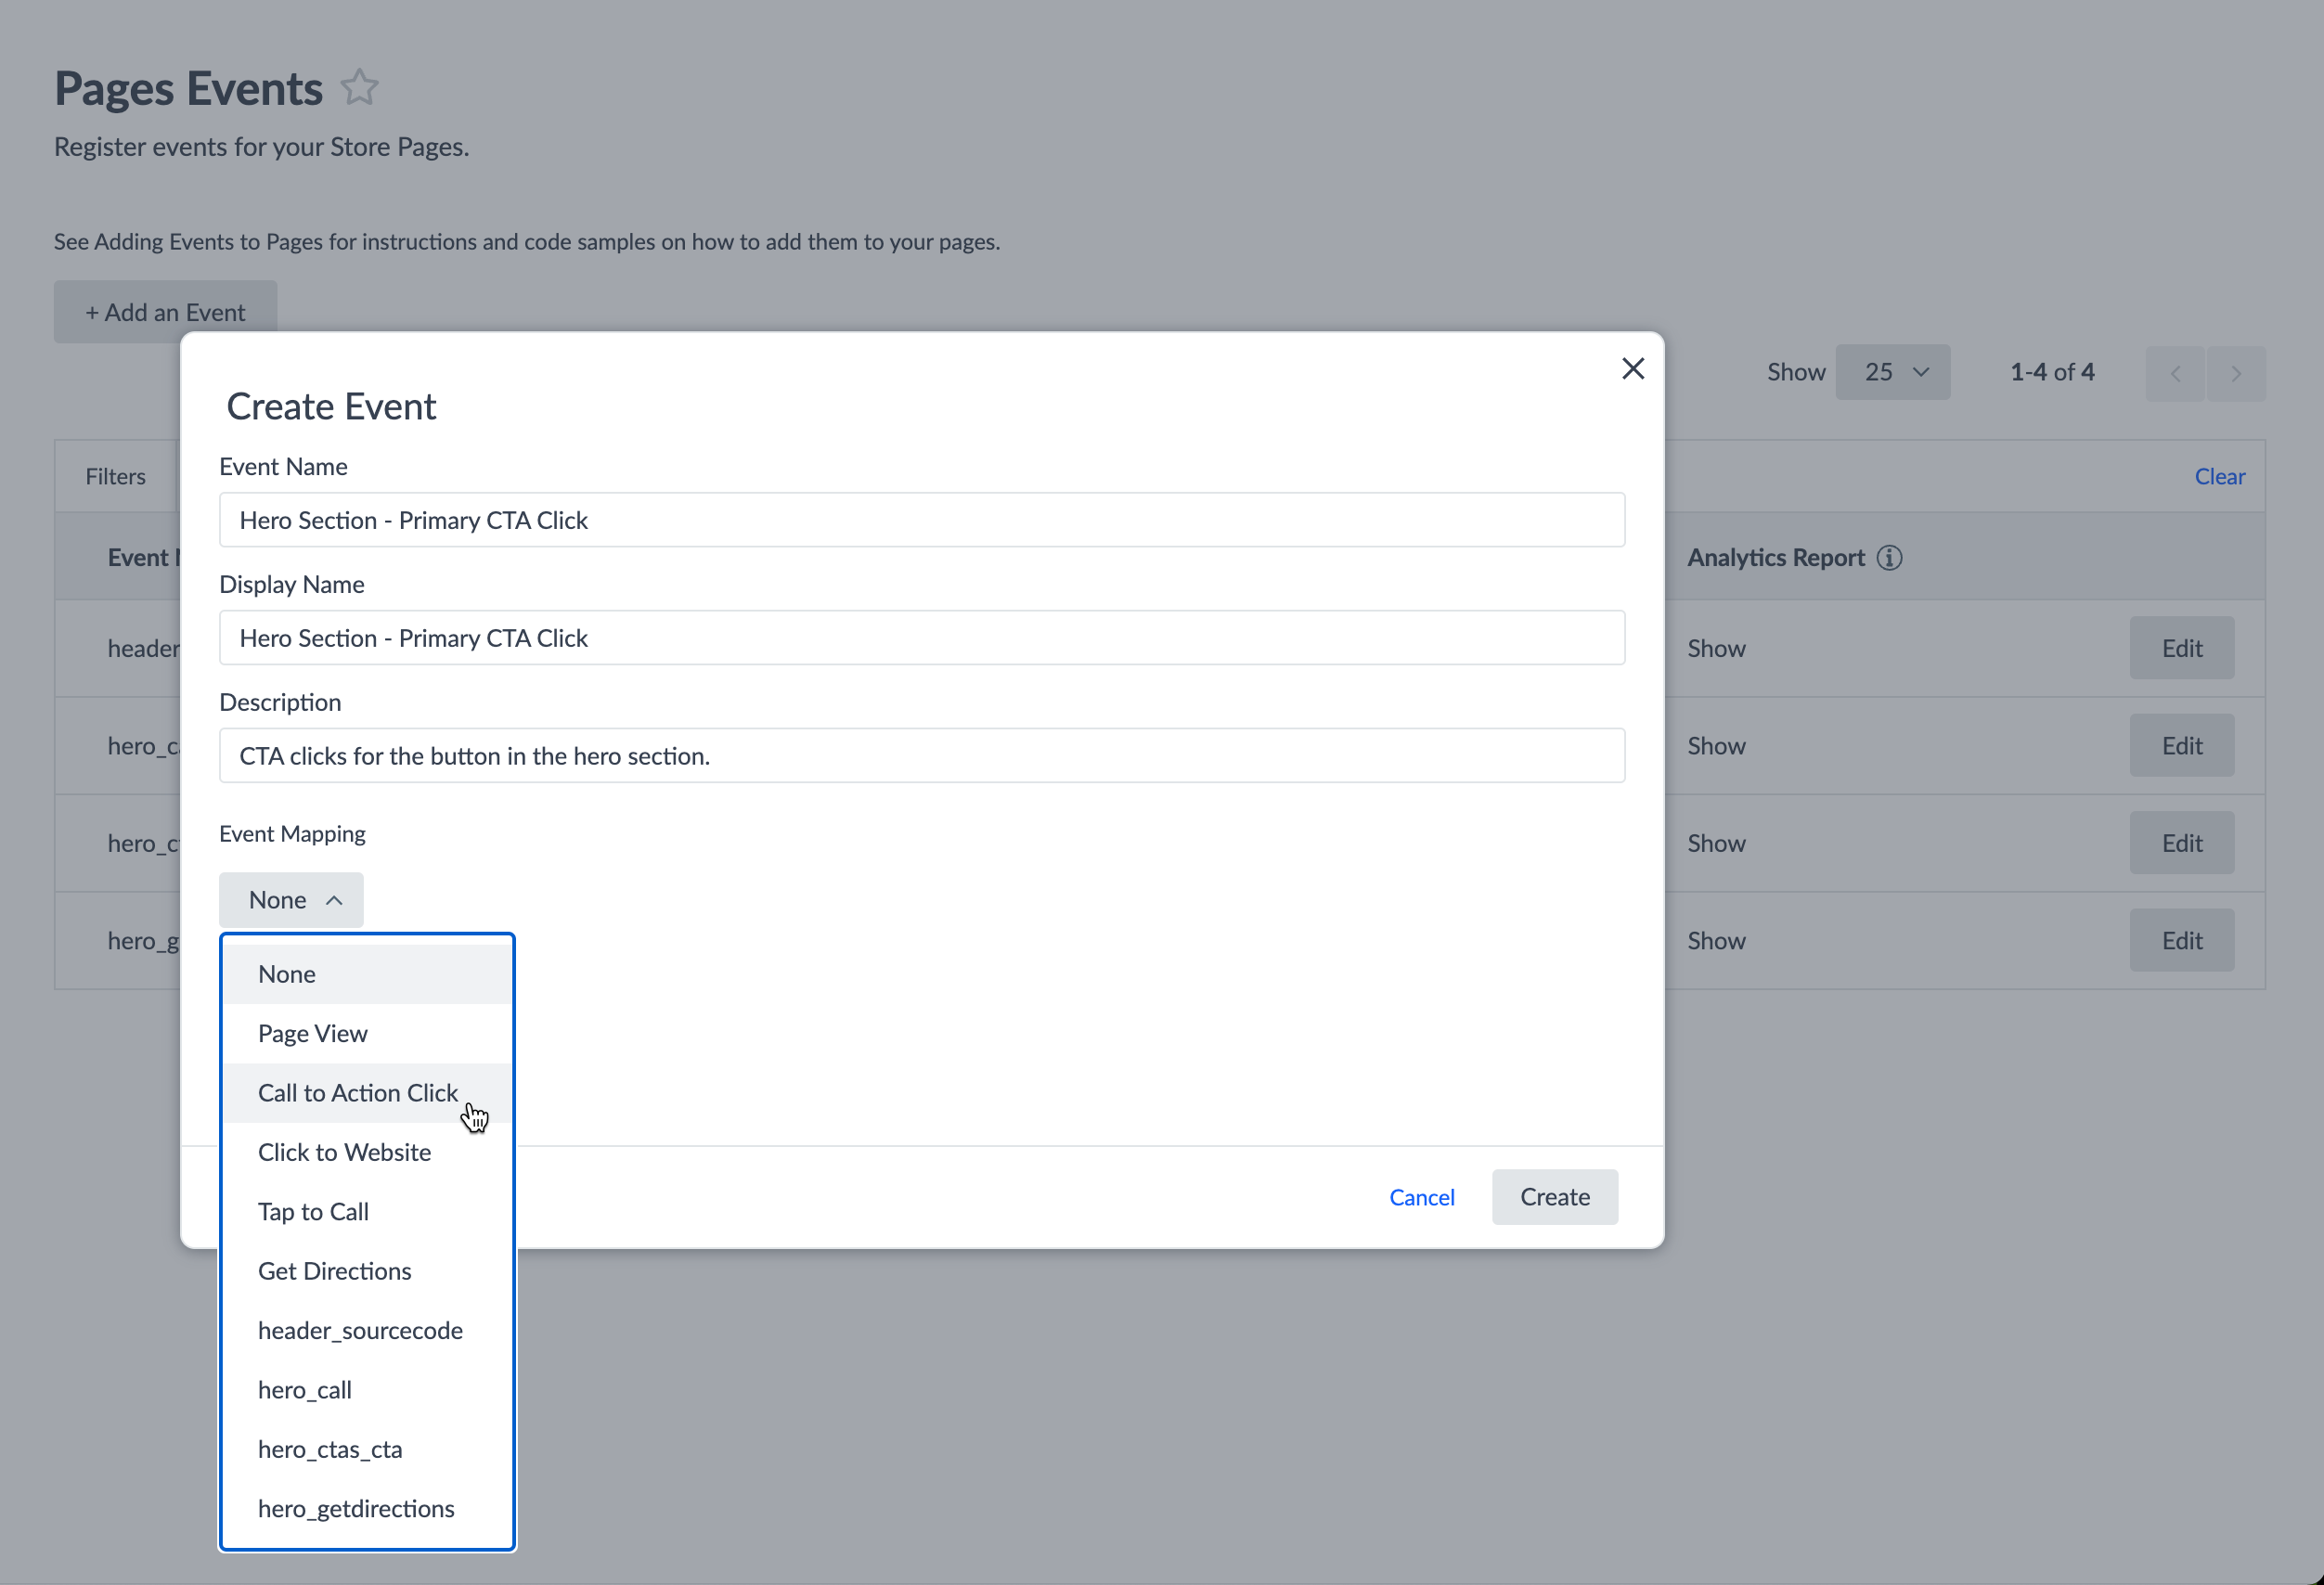
- Navigate to Analytics and select Page Events.
-
Use the interface to map custom events from your website to Yext's predefined event types such as "Call to Action Click," "Get Directions," and "Tap to Call."
- Segment these events by various dimensions to create consistent, actionable analytics reports.
Report Builder
Yext's Report Builder enables in-depth analysis with comprehensive customization and visualization. By default, Page Views is the only default report available for Pages, but you can create custom reports to monitor other metrics such as Google Search Console average position, click-through-rate, clicks, and impressions.
Refer to the Report Builder & Custom Insights module to learn more.
"Website Traffic" Dashboard
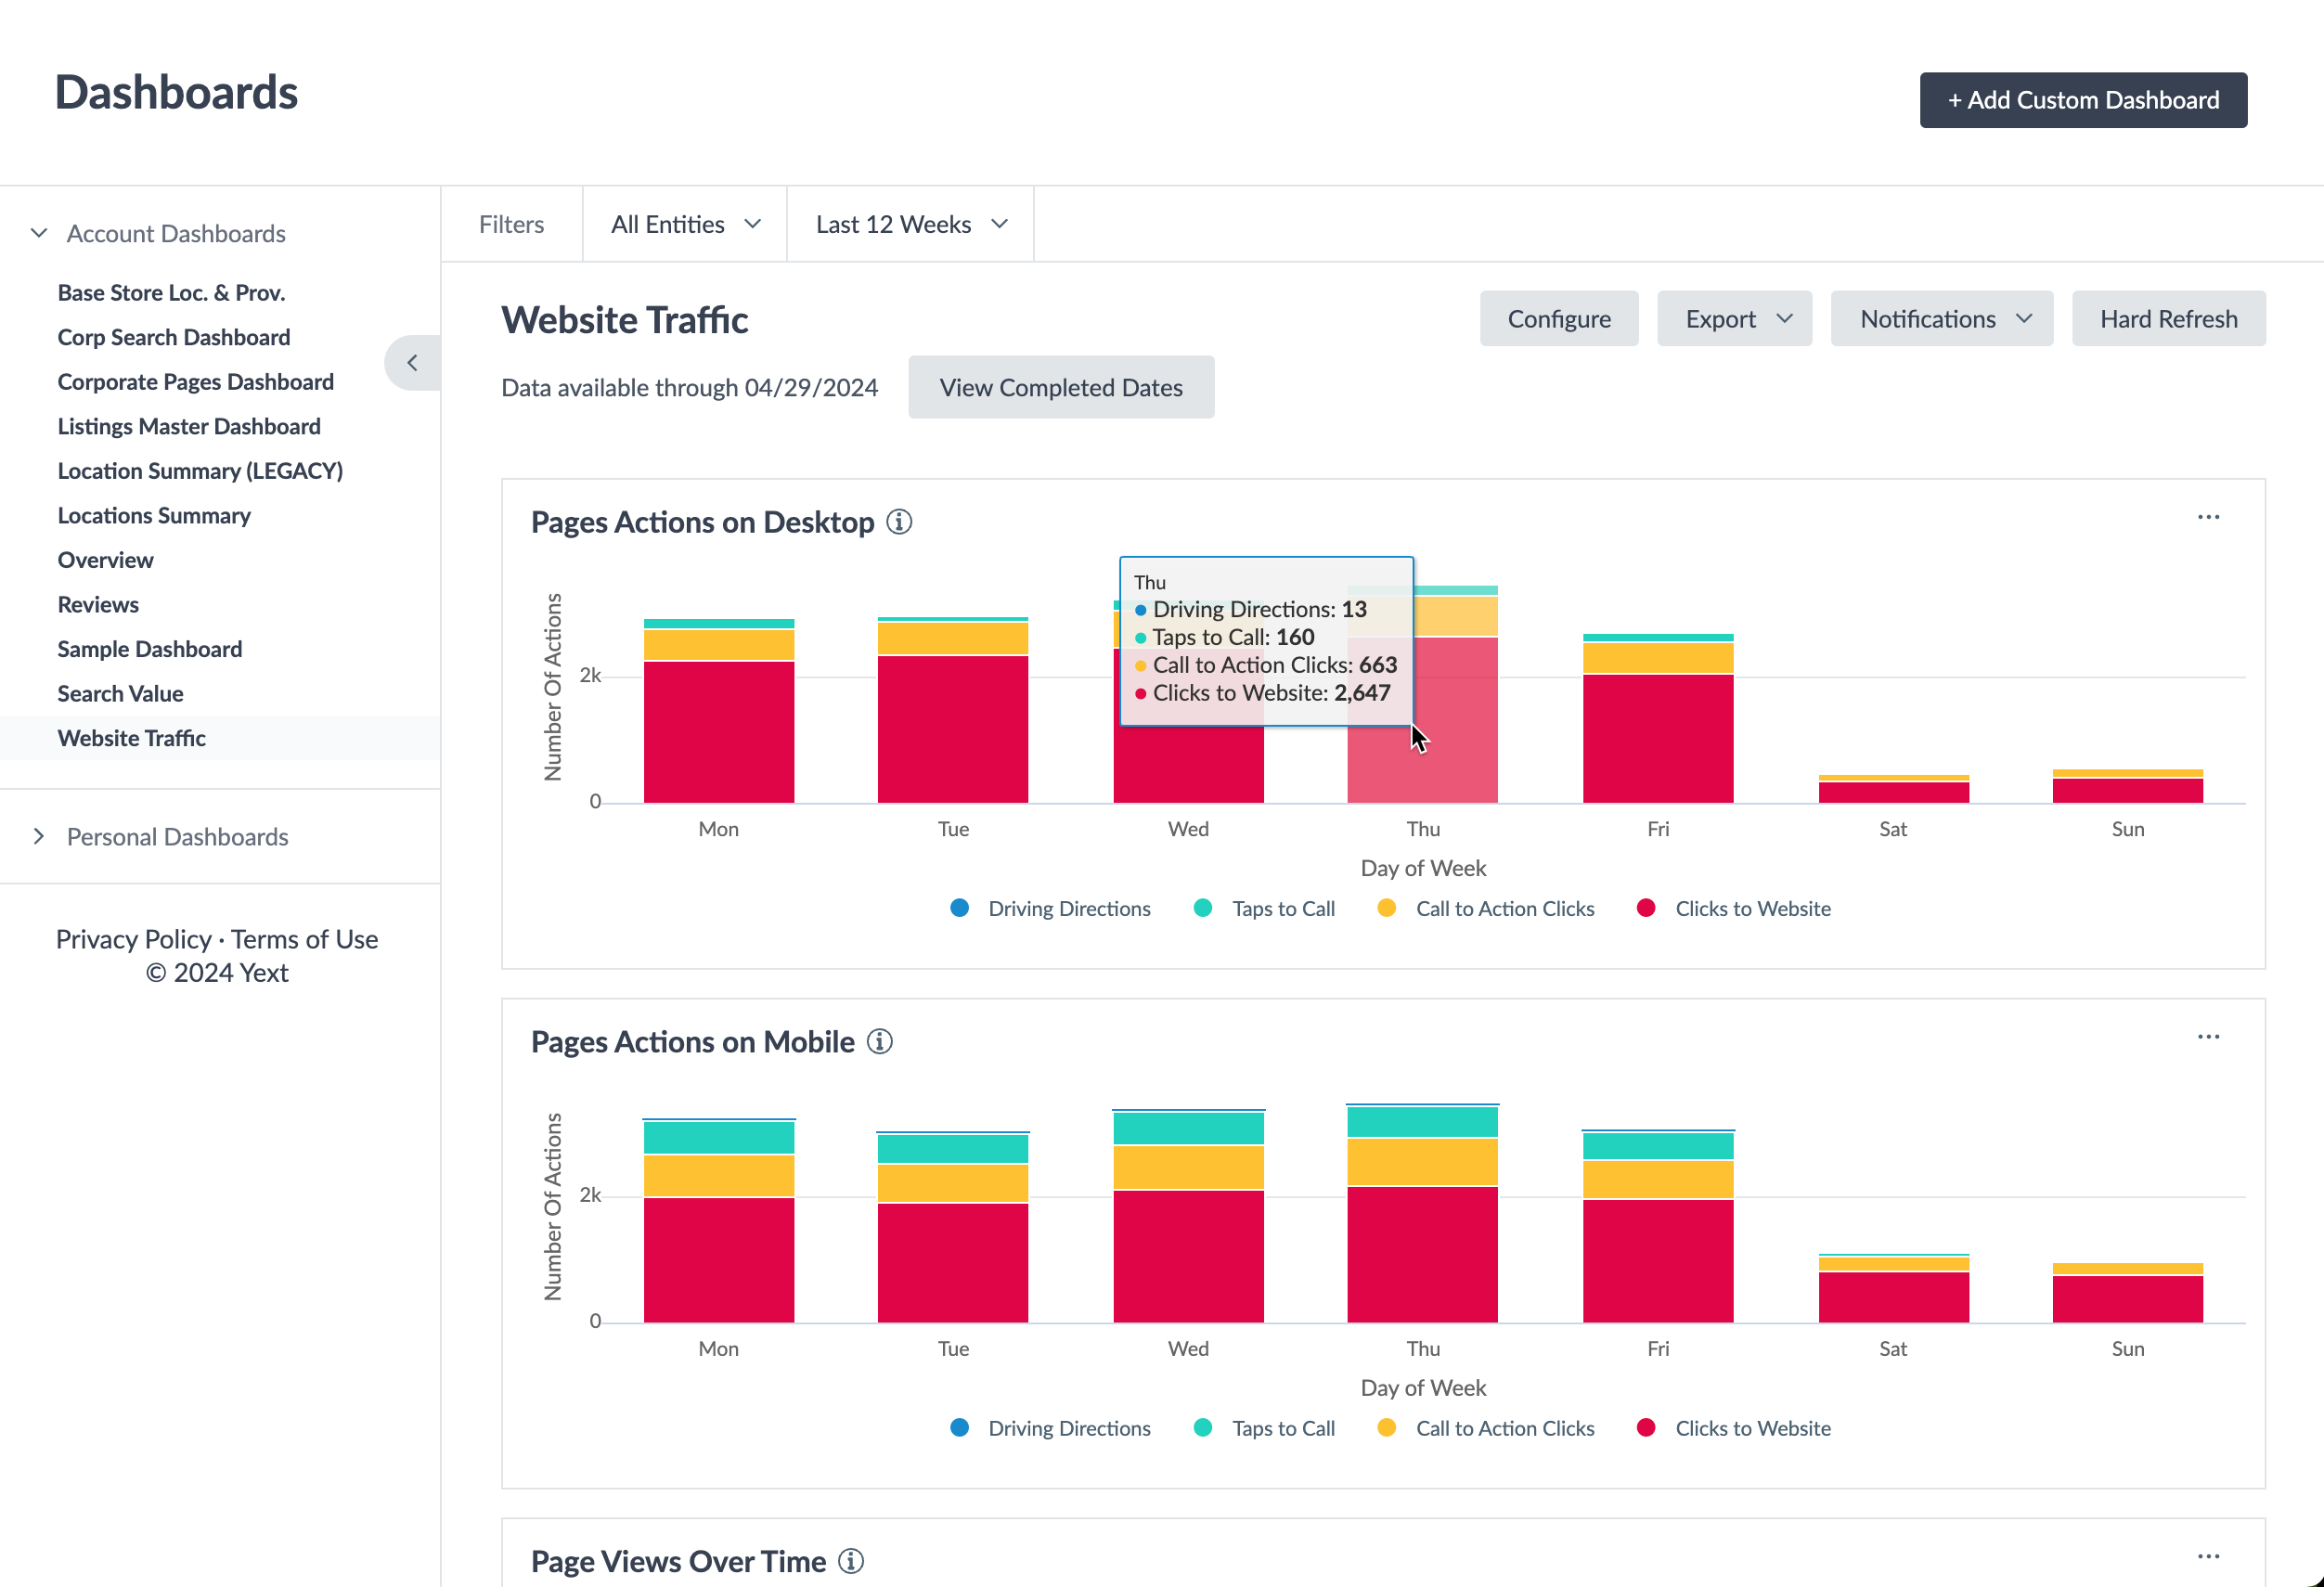
The "Website Traffic" dashboard is a default setup provided by Yext focused on key metrics for monitoring site traffic. Features include:
- Page Actions by Device: Track user interactions on desktop and mobile.
- Page Views Over Time: Visualize trends and identify peak periods.
- Page Views by Platform: Break down page views by device type (desktop, mobile, tablet).
- Page Views by Referrer: See which channels (Facebook, Google, Yelp, Bing, etc.) drive traffic.
- Google Search Console Metrics: Branded vs. unbranded impressions, search visibility, etc.
- Engagement Metrics: Time on page, bounce rate, and other engagement indicators.
Refer to the Analytics Dashboards module to learn more.